The IIoT Augments the Power of Data Analytics
Insights | 26-09-2024 | By Gary Elinoff
IIoT and Data Analytics
Key Takeaways about The IIoT Augments the Power of Data Analytics:
- The term Industrial Internet of Things (IIoT) is often used interchangeably with the term Internet of Things (IoT).
- Data Analytics is used to convert sensor readings from across the facility into actionable insights.
- The IIoT makes it possible to meld analytics gathered across facilities located anywhere in the world, and to thereby enjoy additional advantages.
Introduction
We’ve spoken about the Industrial Internet of Things and then described some of its benefits in a subsequent article entitled IIoT Basics and Key Benefits of Industrial Internet of Things. Some of those benefits include:
- Predictive Maintenance
- Industrial Automation
- Robotics
- Logistics
We learned that the term Industrial Internet of Things (IIoT) is often used interchangeably with the term Internet of Things (IoT). It’s really only a matter of degree, with IIoT more often used for commercial applications and IoT for consumer devices. We mention that here to save the reader from any unnecessary confusion.
Predictive Maintenance relies on a network of sensors that monitor multiple points located throughout the system being monitored and controlled; for example, a complex industrial machine vital for the operation of a factory. These sensors are connected to the IIoT, which causes them, in their hundreds or even thousands, to be monitored and recorded continuously.
The amount of data will be titanic – perhaps hundreds of points, each monitored any number of times per minute as deemed necessary. These values are then uploaded to a central point, often to a server located anywhere in the world, where they are collectively recorded and evaluated, providing engineers and managers with useful information.
So far, all we’ve recorded are readings of parameters such as temperatures, pressures, vibration, currents and voltages. How are these disparate, seemingly unrelated readings molded into useful information?
The answer is IIoT Data Analytics.
What is IoT Analytics?
As described by PTC[1], “IoT analytics is the analysis of data generated from connected devices. The true value of IoT solutions lies in the data. Every connected device can generate thousands—or even millions—of data points every day. Contained in that IoT data are the answers to business problems, diagnoses for machine failures, and even predictions for the future.” As described in the company’s “Unlocking IoT value through analytics” video, IoT Analytics is the process through which connected data is captured and contextualized.
Analytical techniques used for analyzing the wealth of data gleaned from the IoT include:
- Machine learning
- Statistical methods
- Data visualization
Machine Learning
As described by Oracle [2], “Machine learning is an application of artificial intelligence (AI) that enables computers to automatically learn and improve from experience without being explicitly programmed.”
The process depends first on engineers developing models that analyze the data obtained by the IIoT. This data is typically voltage and current readings, valve temperature and integrity, vibrational parameters – anything that designers foresee as potentially important on the device being monitored and controlled. These models must first be trained by exposing them to enormous amounts of historical data and amalgamating it with the readings supplied through the IIoT.
The model then learns in a manner analogous to the way a living organism learns – that’s why it’s called artificial intelligence. Then presented with new data, it reacts to those new conditions, based on what it has “seen” and “learned” previously.
Statistical Methods
As reported by The Science and Information Organization (SAI)[3], “Anomaly detection in the context of IoT involves identifying unusual or abnormal behavior in the data generated by IoT devices.” Data points from the device being monitored or monitored and controlled are statistically analyzed, with the goal of detecting possible system failures or security breaches.
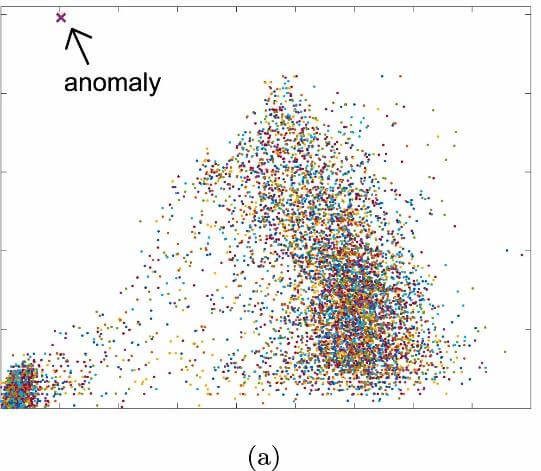
Any point too far away from other readings can be viewed as a possible anomaly. Image source: SAI
One common statistical method is the use of probability distributions. As illustrated above, any reading that is too far off the mean is flagged as a possible anomaly.
Data Visualization Platforms
Xyte[4] describes IoT Data Visualization as “the process of transforming raw data into clear and actionable visuals. Charts, graphs, maps, and dashboards bring the data to life, revealing patterns, trends, and anomalies that would be difficult to spot in numbers alone.”
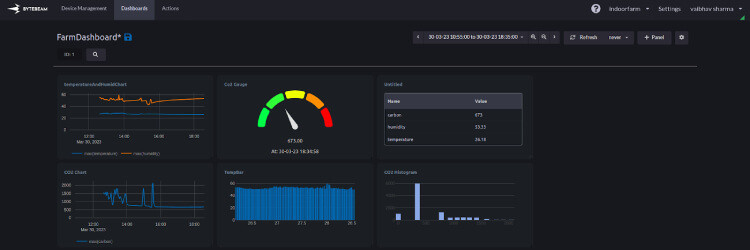
Oftentimes, the easiest way to comprehend the vast amounts of data generated by IoT sensors is through visual representation. Image source: Bytebeam
Presenting IoT data in a visual format can, in many cases, make it easier to understand. As N-iX[5] points out,” Converting raw data into intuitive visual formats enables users to detect correlations, monitor changes over time, and make data-driven decisions.”
Real-World Examples of IoT Data Analytics in Industrial Settings
Texmark leverages real-time data to reduce operating costs via improved maintenance and performance of key assets
As a chemical manufacturer, safety is a key requirement for Texmark. As reported by PTC, the company relied on workers to manually check production machines on fixed schedules, make manual adjustments, and report results via paper-based forms.
Texmark knew that change was necessary when this unsatisfactory system caused their insurance company to double their deductible.
“Everyone wanted an IoT solution at that point because we could all see the value,” says Linda Salinas, VP of Operations at Texmark. “Management saw less time spent taking care of pumps that didn’t require attention, and operators saw less risk to employees.”
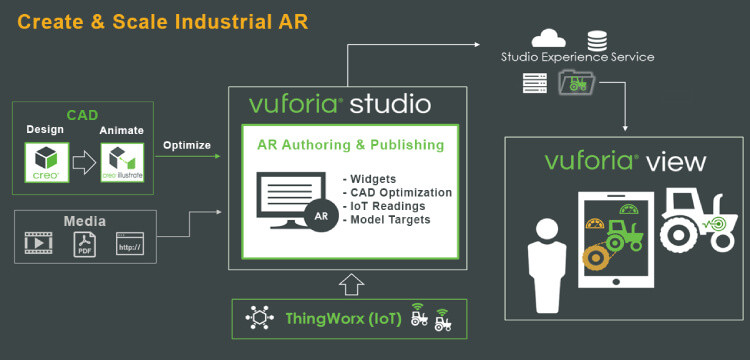
PTC’s Vuforia Studio. Image source: PTC
PTC’s Vuforia Studio now enables workers using handheld devices to ascertain the health of critical operational components in real-time, with far less need for generalized, fixed-schedule inspections.
Western Digital Consolidates Data and Applications
Oracle[6] reports that Western Digital’s acquisitions of companies such as Hitachi Global Storage Technologies and SanDisk made it more and more difficult to capture data from an array of locations and then expeditiously analyze it. At one point, it took as long as 48 hours for analysts to receive analytics. Through the standardization of data and workflows on a cloud-based system with pre-configured reporting, that time has been reduced to 20 minutes.
HarbisonWalker International Improves Forecast Accuracy and On-Time Order Delivery.
Oracle[6] describes how this manufacturer of refractory products now has to coordinate operations across facilities located across three continents. The answer was to consolidate data and applications into a single IIoT-based ERP system. The result was a 90% improvement in on-time delivery.
Challenges and Opportunities
Edge computing allows for some simpler analysis to be performed on the spot, not just at the facility level but at a point directly adjacent to the relevant sensor. A major challenge facing manufacturers is to make better use of this possibility. Two reasons are immediately apparent.
Edge computing allows for emergency situations, such as a broken pump, to be addressed immediately without waiting for a decision to be made thousands of miles away.
The other challenge is the internet itself. This worldwide system even now uses a hefty amount of the world’s electrical power. Ironically, it is the ever-greater use of server-based artificial intelligence itself that is responsible for this power grab, and there’s no end in sight. The cost of transmitting the vast amounts of data that machine learning requires is rising, and in some locations, the networks are finding it more difficult to meet the burgeoning demands.
The challenge will not only be to implement edge computing but also to do so in a manner that doesn’t compromise the central server’s ability to see what is happening at each server in a way that isn’t compromised by simplification.
Wrapping Up
The IIoT (or IoT, if you prefer) is a perfect partner to data analytics. Data analytics takes digital representations of sensor readings, and renders them into useful information about a manufacturing facility’s operational health. The IoT allows the data from remote facilities to be electronically transferred to a central server to be analyzed.
Here, the data from each location can be analyzed separately, and as a titanic bonus they can be compared, and further studied. Commonalities as well as differences can be exploited, with the result that greater efficiency, safety and economy can be achieved.
References:
- IoT Analytics: https://www.ptc.com/en/technologies/iiot/iot-analytics
- What is machine learning for analytics?: https://www.oracle.com/business-analytics/what-is-machine-learning-for-analytics/
- Data Anomaly Detection in the Internet of Things: A Review of Current Trends and Research Challenges: https://thesai.org/Downloads/Volume14No9/Paper_1-Data_Anomaly_Detection_in_the_Internet_of_Things.pdf
- IoT Data Visualization: Benefits, Challenges and Use Cases: https://www.xyte.io/blog/iot-data-visualization
- A comprehensive guide to IoT data visualization: https://www.n-ix.com/iot-data-visualization/
- What Is Manufacturing Analytics?: https://www.oracle.com/scm/manufacturing/manufacturing-analytics/
Glossary of Terms
- AR (augmented reality) Authoring. Overlaying digital content with actual physical reality. Makes it easier for human users to understand unfolding conditions taking place in a system being monitored.
- ERP. Enterprise resource planning is achieved by means of a software suite that users can use to garner, record, manage and analyze engineering and financial data.